Product Description
Quantifying market structure state transitions into chart markers
Utilizing price, volume, and multi-timeframe momentum as variables, fixed rules determine the establishment, continuation, and invalidation of structural states. Symmetrically deployed on TradingView.
What is TTMA-Quant?
T.T.M.A = T.S.Wei Technical Market Analysis
A technical quantitative structural marking tool deployed on TradingView
Minimizing subjective bias
Structural changes are marked using fixed rules to ensure a consistent baseline of observation across different periods and underlying assets.
Visualization replaces calculation
Multi-factor computation results are organized as labels on the chart. Readers refer to labels rather than formulas.
Acknowledge variations in market environments
All quantitative methodologies are subject to market conditions. The system encourages cross-period and cross-market comparisons, rather than extrapolating future performance from results of a single period.
Bullish System: TTMA-Quant Bullish
Observe the formation, continuation, and invalidation of the ascending structure

🚀
Structural Gap Anomaly in Index-Index-Tracking Underlying Assets
Quantitative Definition
The index underlying opening price exhibited a significant discontinuous displacement compared to the prior trading period.
Research Significance
Reflects potential gap structures in price sequences, serving as an observation variable for analyzing price continuity, volatility states, and structural market changes.
S Alpha
Multi-Frequency Momentum Resonance
Quantitative Definition
Multiple technical analysis variables simultaneously met designated conditions within a close timeframe, establishing a highly correlated state of momentum resonance.
Research Significance
Identifies anomalous states characterized by the simultaneous convergence of multiple volume-price factors, observing the correlations among market momentum, volatility, and price changes.
L1
Quantitative structure established
Quantitative Definition
The historical volume-price structure has reorganized within the lower range, with multiple variables—including price, volume, and trend momentum—exhibiting alignment in direction.
Research Significance
Identifies the probability of a market transition from a weak structure to an upward structure, reflecting positive resonance across multi-timeframe volume and price factors.
V1
Retracement structure validation
Quantitative Definition
Following the formation of an upward structure, short-term momentum experienced a phase-specific retracement, returning to the statistical observation range.
Research Significance
Observe the stability of the rising structure following short-term fluctuations, alongside the recoupling of price, momentum, and statistical bands.
D1
Abnormal Positive Deviation
Quantitative Definition
The price has exhibited a significant positive divergence from the core trend channel, with the degree of deviation exceeding the established statistical threshold.
Research Significance
Identify extreme upward deviations in price relative to the baseline structure, serving as research parameters for momentum expansion, volatility expansion, and mean reversion.
S1
Bullish structure failure
Quantitative Definition
Multiple reversal and structural conditions have reached their defined thresholds simultaneously (momentum decay, volatility anomaly, and price structure disruption, among others), and the system has marked the state as a structural failure.
Research Significance
Identify whether the original upward structure has sustained significant disruption, and observe the probability of the market transitioning to a neutral, range-bound, or reconstructing state.
Red S1 | Structural Confirmation—Relevant conditions are confirmed within the data sequence.
Blue S1 | Structural Deviation - The divergence between actual data and model expectations, potentially influenced by price ticks, data latency, or liquidity fluctuations.
Bearish system TTMA-Quant Bearish
A five-level marking symmetrical to the long-side system, observing the establishment, continuation, and invalidation of the descending structure
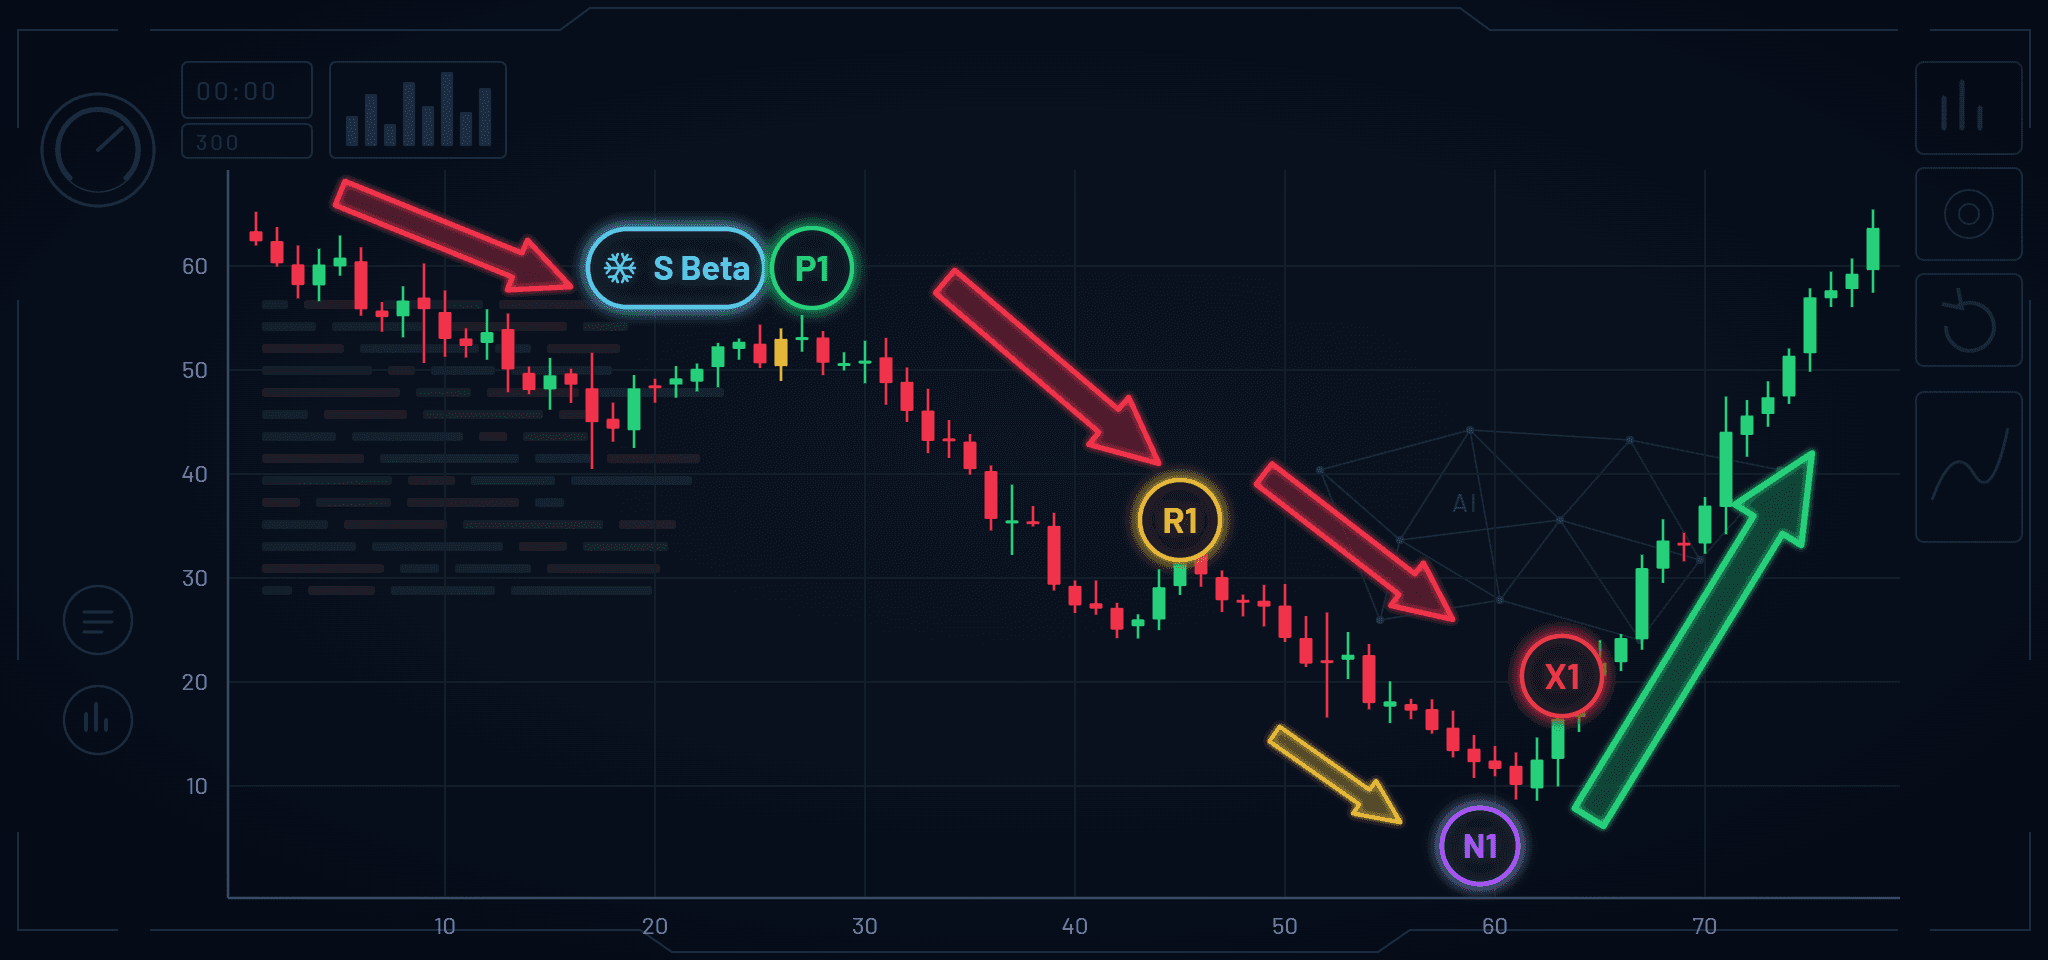
❄️S Beta
Negative momentum resonance
Quantitative Definition
Multiple technical analysis variables concurrently reached negative structural states within a similar timeframe, generating a highly correlated downward momentum resonance.
Research Significance
Identify abnormal states where multiple volume-price factors simultaneously converge downward, and observe the correlation among negative market momentum, volatility, and price changes.
P1
S1 structure established
Quantitative Definition
Historical volume-price structures have weakened in high-level areas, with multiple variables including price, volume, and trend momentum showing downward alignment.
Research Significance
Identifies the potential transition of the market from an upward structure to a downward structure, reflecting a negative resonance of multi-timeframe volume and price factors.
R1
Rebound structure verification
Quantitative Definition
Following the formation of a downward structure, short-term momentum experienced a temporary rebound to the statistical resistance zone before declining once again.
Research Significance
Observe the extent of continuation in the downward structure after a short-term rebound, alongside the recoupling of price, momentum, and statistical intervals.
N1
Negative deviation anomaly
Quantitative Definition
A significant negative deviation has occurred between the price and the core trend channel, with the degree of divergence exceeding the established statistical threshold.
Research Significance
Identify extreme downside deviations of price relative to the baseline structure, serving as research parameters for oversold divergence, volatility expansion, and mean reversion.
X1
Failure of the S structure
Quantitative Definition
Multiple reversal and structural conditions have reached designated thresholds simultaneously (including the attenuation of bearish momentum, the re-emergence of bullish momentum, and price structure reconstruction), and the system marks the bearish structure as invalid.
Research Significance
Identify whether there is a significant change in the original descending structure, and observe the possibility of the market transitioning to a neutral, range-bound, or reconstructed state.
Red X1 | Structure confirmed—relevant conditions have been confirmed within the data sequence.
Blue X1 | Structural Deviation - actual data deviates from model expectations, potentially affected by price fluctuations, data latency, or liquidity changes.
How to interpret these system state markers
Six Research Principles
Based on closing data
All structural states are determined primarily based on daily candlestick closing data. Intraday data is for real-time observation only; the state approximately 10 minutes prior to the close may serve as a reference, but does not replace the final assessment after the close. Real-time data and latency vary across different markets on TradingView, and the platform's current information shall prevail.
Multiple structural markers occurring on the same day
When the market is in a structural overlap or consolidation environment, different types of markers (such as L1 and S1) may appear on the same day. In such cases, the system prioritizes the observation of changes represented by structural invalidation. This is a normal phenomenon of the quantitative model under specific conditions and does not represent any future results.
Unforeseen Events
The system organizes existing market data and cannot incorporate breaking news, macroeconomic data, or corporate announcements. If the market changes rapidly due to sudden events after a mark appears, such developments should be treated as new research variables.
Consolidation phase
During consolidating markets, the system may exhibit more frequent structural changes or overlapping markings. Such periods serve as suitable material for observing model characteristics, rather than for inferring market outcomes solely based on short-term markings.
Timeframe
The system default is set to the daily chart, with the option to switch to the weekly chart or other timeframes. Larger timeframes display the overall trend structure, while smaller timeframes reflect short-term momentum changes; comparing the two helps establish a multi-timeframe analysis framework. For instance, the weekly L1 can be utilized to observe the long-term structure, while the daily or 30-minute charts can be used to monitor the corresponding short-term fluctuations.
Simultaneous Long and Short Positions
Under the multi-directional strategy, both Bullish and Bearish marking systems can be displayed simultaneously on a single chart. The relative positioning and chronological sequence of the two sets of markings within the same interval serve as reference data for observing the structural transition process.
System Environment and Compatibility
Four Things to Know Before Use
TradingView
Available in Free Version
The system fully supports the TradingView Basic (free) plan. Paid plans offer ad-free usage and additional charting features, but are not required.
Indicator Quantity Limit
The TradingView free plan has a limit on the number of indicators per chart. The long-short combination consists of two indicators; if additional indicators are to be applied simultaneously, please verify the limit of your current plan.
Script Name
The script for the long system is named TTMA-Quant Bullish, and the script for the short system is named TTMA-Quant Bearish. Upon deployment, the name and version number are displayed in the upper-left corner of the chart.
Chart Background and Setup
For optimal visibility of the markers, it is recommended to set the chart background to Dark Mode. The display synchronizes automatically between the TradingView web platform and the mobile app without requiring additional installation.
How does the 7-day trial function?
Allocate time to historical backtesting and logical verification
A seven-day period is insufficient to observe the system's performance across various market environments. The objective of the trial is to comprehend the system's logic and limitations, rather than to verify historical performance.
Applying the system to familiar markets and timeframes allows for historical chart reviews covering at least the past year. Observing the precise locations of each marked state, subsequent price movements, and instances where the marked states failed to sustain provides a basis for evaluating alignment with existing research methodologies.
Subscription Plans
Subscribers of any system before 11/1 ($29/month) will have access to the L1 S1 S Alpha portfolio (originally $45/month).
$29/month, $290/year
Annual payment equivalent to ten months
$29/month, $290/year
Annual payment equivalent to ten months
Annual payment saves the equivalent of 2 months