TTMA-Quant Market Structure Marking System
TTMA-Quant Market Analysis & Decision System
TTMA-Quant Market Analysis & Decision System
Establishing a quantitative research framework based on technical volume and price analysis to develop proprietary market analysis methodologies.
Technical analysis as the primary framework, supplemented by fundamental analysis
Establishing a quantitative research framework based on technical volume and price analysis to develop proprietary market analysis methodologies.
Technical analysis as the primary framework, supplemented by fundamental analysis
Derived from academic research of a National Taiwan University EMBA Master's thesis
Derived from academic research of a National Taiwan University EMBA Master's thesis
Derived from academic research of a National Taiwan University EMBA Master's thesis
Seven markets, 34 public cases, continuously updated
Seven markets, 34 public cases, continuously updated
Seven markets, 34 public cases, continuously updated
Provided as a TradingView indicator
Provided as a TradingView indicator
Provided as a TradingView indicator
You see minimalism because we handled the complexity.
The system acts solely as an objective recorder; the markings reflect the "current structure" rather than forecasting the "future path."
Case Study on Quantitative Market Structure Analysis
Historical Correlation Between System Markings and Market Trends

Taiwan Weighted Index: A Complete Cycle of Quantitative Structure
Taiwan
Full sample of the structural cycle
2026/04/14 (L1) – 2026/07/13 (S1)

Micron Technology (MU): S1 at high levels twice
the US
Global semiconductor heavyweight equities
2026/04/14 (L1) to 2026/06/25 (Second S1)

KOSPI Index: S1 Prior to Market-Wide Circuit Breakers
South Korea
Major Global Indices / Sample during Extreme Event Periods
2026/06/26 (S1) – 2026/07/13 (circuit breaker)
View more TTMA-Quant market cases
You see minimalism because we handled the complexity.
The system acts solely as an objective recorder; the markings reflect the "current structure" rather than forecasting the "future path."
Case Study on Quantitative Market Structure Analysis
Historical Correlation Between System Markings and Market Trends
Taiwan Weighted Index: A Complete Cycle of Quantitative Structure
Taiwan
Full sample of the structural cycle
2026/04/14 (L1) – 2026/07/13 (S1)
Micron Technology (MU): S1 at high levels twice
the US
Global semiconductor heavyweight equities
2026/04/14 (L1) to 2026/06/25 (Second S1)
KOSPI Index: S1 Prior to Market-Wide Circuit Breakers
South Korea
Major Global Indices / Sample during Extreme Event Periods
2026/06/26 (S1) – 2026/07/13 (circuit breaker)
View more TTMA-Quant market cases
Recent New Cases
The market case database is continuously updated; the following are the three most recent cases.
Taiwan
Nanya Technology: All-Time High Following L1 Reconstruction
S1 (end of July, approximately 250 TWD) → L1 → V1 → Long structure maintained for 14 days, base point deviation rate +31.36%
Taiwan
Walsin Technology: Rapid rise in S Alpha over six trading days
S1 (mid-June, approximately 640–670 TWD) → S Alpha → bullish structure maintained for 6 days, benchmark deviation rate +27.66% → D1
the US
SpaceX: S Alpha Resonance Prior to the Launch of Hashrate Contracts
S Alpha → D1(1), D1(2) → V1 → Long-side structure sustained for 26 days, benchmark deviation rate +8.57%
View All Case Studies →
Cultivate Intuitive Visual Discipline with TTMA-Quant
Eleven structural markings for both long and short directions organize market structure states, momentum changes, and volatility characteristics into visual labels on the chart.
Long system
🚀
Structural Gap Anomaly in Index-Index-Tracking Underlying Assets
S Alpha
Multi-Frequency Momentum Resonance
L1
Quantitative structure established
V1
Retracement Structure Validation
D1
Abnormal Positive Deviation
S1
Bullish structure invalidated

Short system
❄️S Beta
Negative Momentum Resonance
P1
S1 structure established
R1
Validation of Rebound Structure
N1
Negative Deviation Anomaly
X1
S1 structural failure
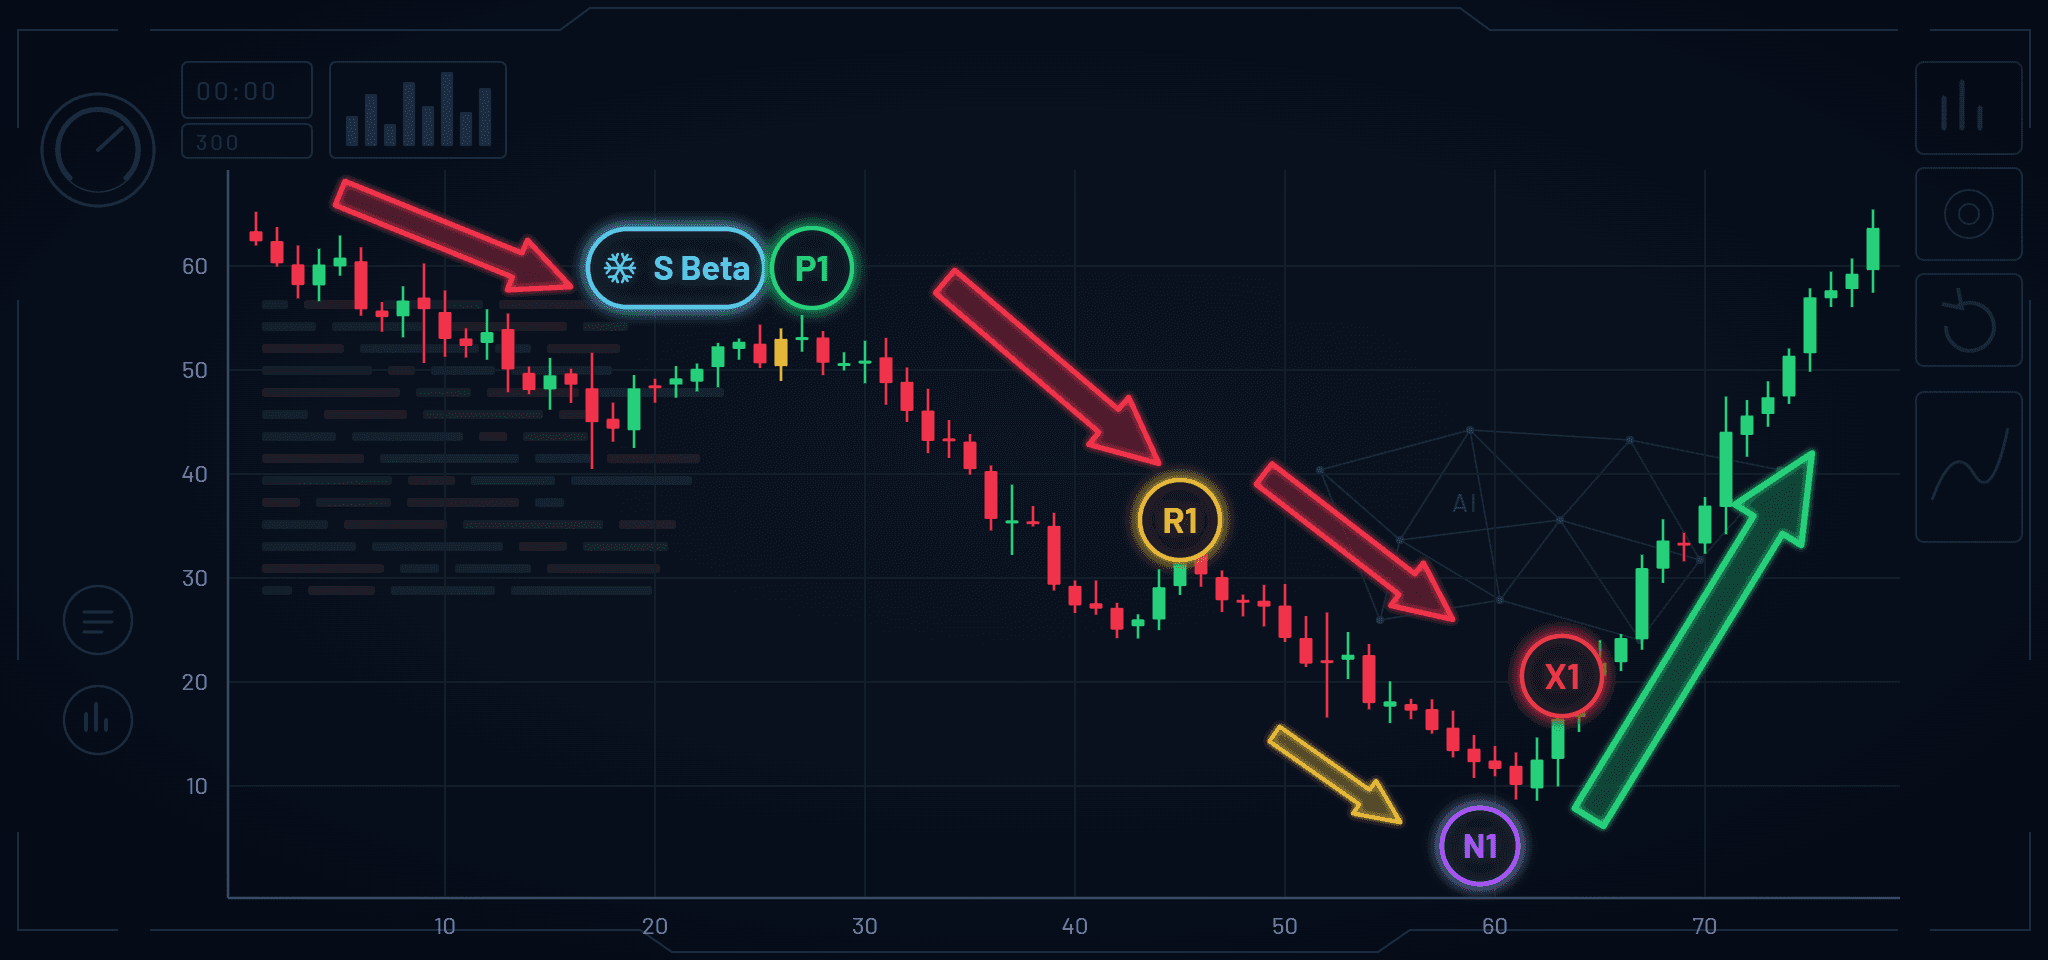
Cultivate Intuitive Visual Discipline with TTMA-Quant
Eleven structural markings for both long and short directions organize market structure states, momentum changes, and volatility characteristics into visual labels on the chart.
Long system
🚀
Structural Gap Anomaly in Index-Index-Tracking Underlying Assets
S Alpha
Multi-Frequency Momentum Resonance
L1
Quantitative structure established
V1
Retracement Structure Validation
D1
Abnormal Positive Deviation
S1
Bullish structure invalidated
Short system
❄️S Beta
Negative Momentum Resonance
P1
S1 structure established
R1
Validation of Rebound Structure
N1
Negative Deviation Anomaly
X1
S1 structural failure
Limited-Time Provision: Subscription to either system includes access to the alternative system at no additional cost
Why Choose TTMA-Quant?
Rather than a single technical indicator, this is a methodology of structural observation replicable across multiple markets.
Structural states, not transactional signals
Eleven distinct markers define the current structural state of the market: formation, continuation, deviation, and invalidation. The system provides no operational execution instructions; structural evaluation remains strictly analytical.
Fixed rules, confirmed at market close
Each state has explicit volume and price criteria, based on closing data. The same criteria are applied consistently across all markets and timeframes.
Two independent long and short systems
L1 and S1 are marked separately, allowing for individual application or side-by-side display on the same chart, with corresponding analysis frameworks for both bull and bear markets.
Continuously updated public case studies
The occurrence of each system state and subsequent market movement is documented, publicly verifiable, and continuously updated. Evidence is available for review prior to making any decisions.
Seven markets, one unified language
The identical set of structural state markers applies universally across the Taiwan, US, Japanese, Korean, and A-share stock markets, as well as cryptocurrencies and foreign exchange, eliminating the need to switch tools.
Utilized directly within TradingView
A free account is sufficient for deployment, featuring 30-second self-authorization without the need to switch platforms or install software.
Why Choose TTMA-Quant?
Rather than a single technical indicator, this is a methodology of structural observation replicable across multiple markets.
Structural states, not transactional signals
Eleven distinct markers define the current structural state of the market: formation, continuation, deviation, and invalidation. The system provides no operational execution instructions; structural evaluation remains strictly analytical.
Fixed rules, confirmed at market close
Each state has explicit volume and price criteria, based on closing data. The same criteria are applied consistently across all markets and timeframes.
Two independent long and short systems
L1 and S1 are marked separately, allowing for individual application or side-by-side display on the same chart, with corresponding analysis frameworks for both bull and bear markets.
Continuously updated public case studies
The occurrence of each system state and subsequent market movement is documented, publicly verifiable, and continuously updated. Evidence is available for review prior to making any decisions.
Seven markets, one unified language
The identical set of structural state markers applies universally across the Taiwan, US, Japanese, Korean, and A-share stock markets, as well as cryptocurrencies and foreign exchange, eliminating the need to switch tools.
Utilized directly within TradingView
A free account is sufficient for deployment, featuring 30-second self-authorization without the need to switch platforms or install software.
Operation Flow
Three steps to start your quantitative research
Establishing a consistent observation process from connection to marking.
STEP 1
Connect TradingView
Binding the TradingView username enables direct activation within the original chart environment.
STEP 2
License Request
Upon submission of the TradingView username, authorization is provisioned automatically via self-service within 30 seconds for immediate activation.
STEP 3
Read structure states
The system computes and marks structural states in real time, assisting in the rapid identification of current market conditions.
Operation Flow
Three steps to start your quantitative research
Establishing a consistent observation process from connection to marking.
STEP 1
Connect TradingView
Binding the TradingView username enables direct activation within the original chart environment.
STEP 2
License Request
Access is granted within 30 seconds via self-service authorization in the Whop system upon provision of the TradingView ID.
STEP 3
Read structure states
The system performs real-time calculation and display of market structure signals, enabling you to instantly assess current market conditions.
Verifying research methodologies with real market cases prior to initiating a trial.
Subscribing to either system before November 1 includes the other system at no additional cost.